About Page
Back to Country ExplorerProject Information and Design Rationale
 img source
 img source
One of the primary, but often overlooked, problems facing the world today is sustainable living, which impacts waste production, natural resource depletion, and most importantly, climate change. For our homework 3, we wanted to visualize the impact of our consumption on a global scale and explore the sustainability of different countries. In doing so, we hope that we can impart the global responsibility everyone has to the environment and make more eco-conscious decisions.
Here is the dataset for country sustainability in 2016.
Here is the dataset for carbon emissions from 1970-2017.
Because we wanted to visualize sustainability on a global scale, we decided to work with d3 geo-projections, and we chose a Mercator projection, which enables the viewer a global view of all the countries without scrolling or zooming. Using this to our advantage, we decided to encode a country’s sustainability using color because the measure is primarily a binary one: The country is either sustainable or unsustainable, perfect for using two colors. We chose red and green, as their conventional connotation conveys “urgent and negative” and “ok to good,” respectively, making the message to the viewer as clear as possible.
The map on its own conveys sustainability for each country and can give the viewer an overview of how the earth is fairing—a global context. However, to give the viewer a deeper look, we also included a stacked bar chart, illustrating the breakdown of a country’s sustainability margin with one bar showing ecological footprint and a second bar showing biocapacity. The stack of each bar will then show the breakdown of the footprint and biocapacity.
A country’s sustainability margin is the country’s biocapacity—how much the land can absorb our waste and generate new resources—minus its ecological footprint—how much the country consumes resources and generates waste. So if a country’s ecological footprint exceeds its biocapacity, then it is unsustainable. If biocapacity exceeds footprint, then the country is sustainable.
We decided to arbitrarily assign colors to the breakdown of the ecological footprint and biocapacity because color connotation doesn’t matter here; it is primarily used for the distinction between categories: cropland, grazing land, forest land, fishing waters, and carbon emissions/urban lands. The more important information the stacked bar chart is conveying should be two-fold: how much a country’s footprint exceeds its biocapacity or vice versa, and what exactly (which category) contributes to a country’s greater footprint or capacity. In doing so, the viewer is able to understand better about what factors of footprint they should be mindful of and hopefully decrease.
As for the interactions, we thought it would not only be entertaining but also educational for the user when they click on a country in the Mercator projection and have the map zoom in while the stacked bar chart for the country appears. That way, the visual is easier on the viewer’s cognitive load, as they can view two visuals simultaneously instead of switching between views, which requires more effort. And not just that—but now the viewer has the freedom to explore the world!
Development Process and Reflection
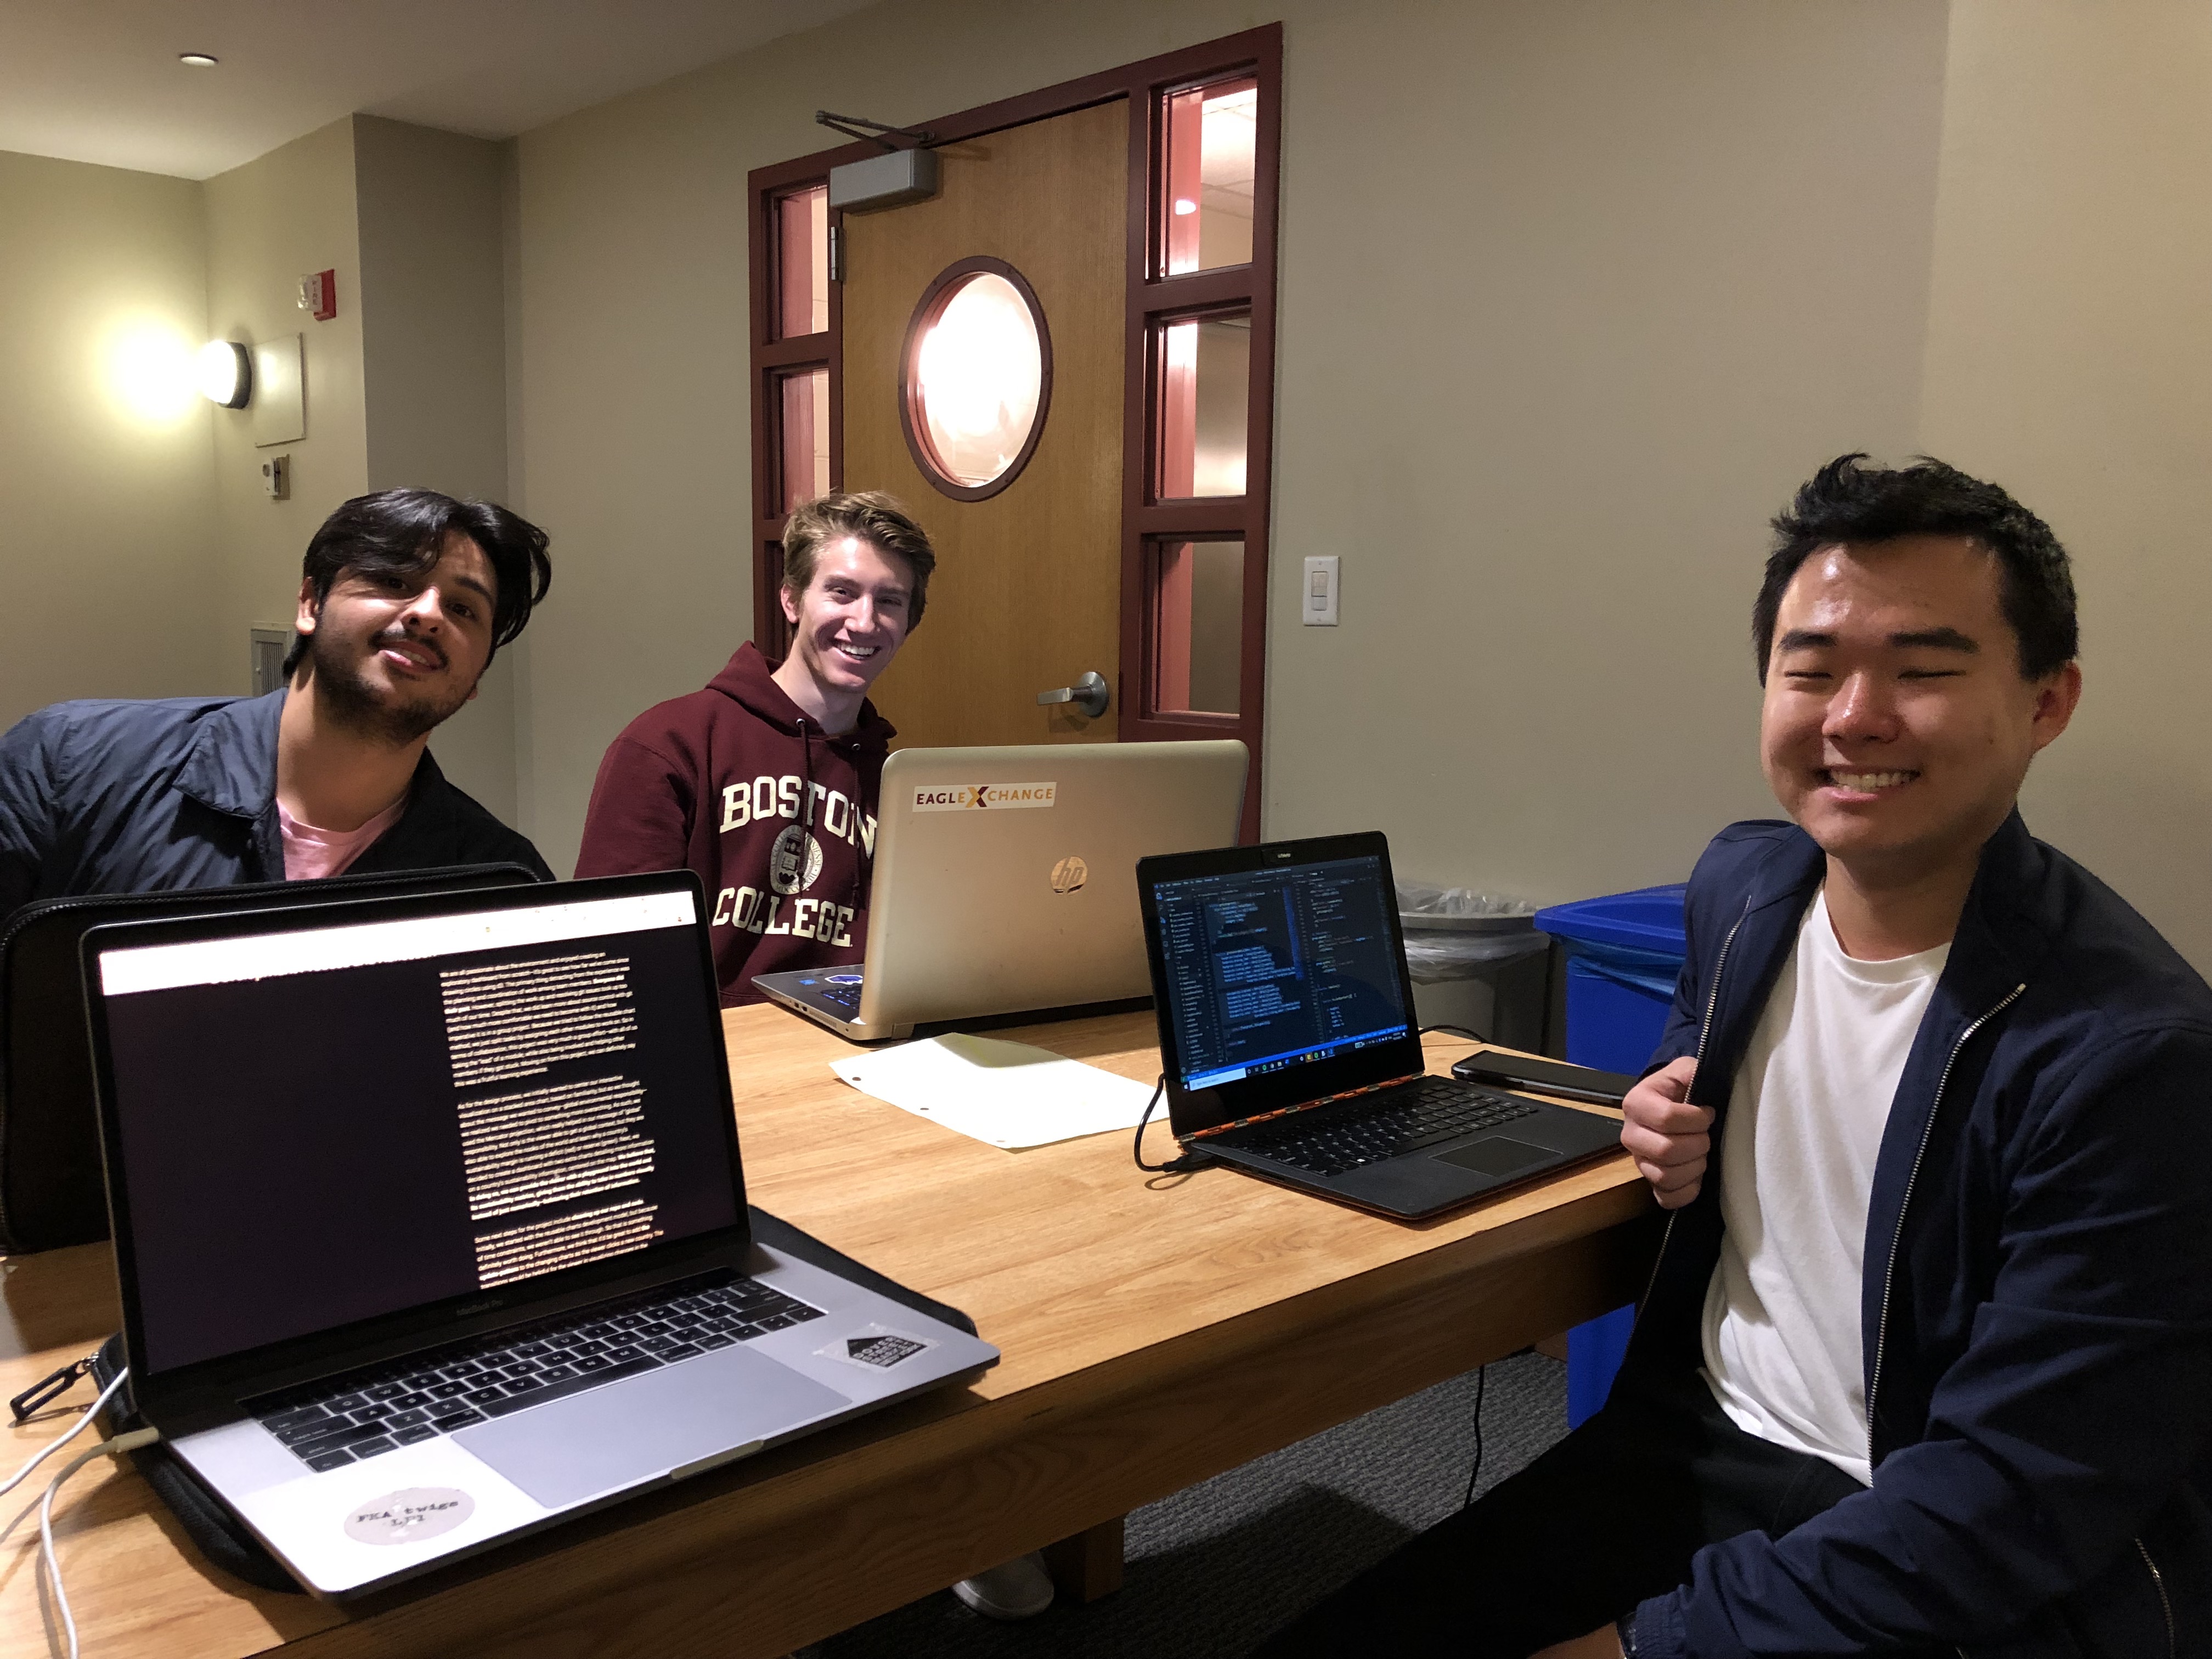
We are all passionate about the environment and enjoyed creating an exploratory dashboard from scratch—it’s great to see how far we’ve come since drawing circles using d3. The primary thing detracting from the experience was the planning and coordination of work among team members. Everyone did their part. However, splitting the work up and resolving git issues took up too much of our time. Despite that, we did learn more about source control with git (and how much more comfortable we need to become with it) and how imperative it is in a group project. Because we tried to follow the reusable chart method, we just split tasks by assigning each other modules to work on. So in terms of collaboration, this project was very much a group effort—with all of us taking the “lead” of a module, while also being involved and helping other members if they got stuck. Moving on from this project, we can definitely say this was a fruitful learning experience.
As for the design process, we initially wanted to center our interactive visualization on a stacked area chart, based on familiarity, but as we thought about the message we wanted to convey—global environmental responsibility—we realized we needed to pivot to something more overarching. As such, we used the Mercator projection, which really helped in our message of “global” responsibility. Not only is the viewer able to get a global context, but they are also able to explore the nooks of the world and learn why a country’s sustainability margin is running a deficit (red) or reserve (green). Next, we decided to create a dashboard with two extra charts detailing more information on a country’s sustainability information, centered on the map. We believe that, in doing so, we can provide the viewer with a playground into the world and its sustainability metrics, giving them the ability to take in numbers visually instead of just numerically—bolstering their retention of information.
Some next steps for the project include cleaning up our repo and code. Initially, we started with the reusable charts development model, but because of time constraints, we weren’t able to see it through. So that is something definitely worth doing. Furthermore, we think that it’d be great to add the update-pattern to the changing charts as the viewer clicks a new country. The transitions would be helpful for the viewer in visualizing changes in the sustainability metrics country to country. This is something we did attempt, but due to the time and our level of comfortability with d3, we couldn’t get the update-pattern working correctly in a coordinated dashboard. This is definitely a future consideration.